Using posterdown to generate reproducible conference posters via RMarkdown > Knitr > Markdown > Pandoc > HTML/CSS > PDF workflow
W. Brent Thorne1, William B. Thorne1
1Department of Earth Science, Brock University
Welcome to posterdown ! This is my attempt to provide a semi-smooth workflow for those who wish to take their RMarkdown skills to the conference world. Many creature comforts from RMarkdown are available in this package such as Markdown section notation, figure captioning, and even citations like this one (Allaire, Xie, McPherson, et al. 2018). The rest of this example poster will show how you can insert typical conference poster features into your own document.
Here is a map made to show the study site using ggplot2, ggspatial, and sf and you can even reference this with a hyperlink, this will take you to Figure 1.1 (Dunnington, n.d.; Arnold, n.d.; Pebesma 2018).
 package.](index_files/figure-html/mymapfig-1.png)
Figure 1.1: Map of Long Lake eample from the ggspatial package.
RMarkdown.posterdown to thesisdown or rticles (Allaire, Xie, R Foundation, et al. 2018; Solomon 2019).This package uses the same workflow approach as the RMarkdown you know and love. Basically it goes from RMarkdown > Knitr > Markdown > Pandoc > HTML/CSS > PDF. You can even use the bibliography the same way (Turner et al. 2014).
Lorem ipsum dolor sit amet, consectetur adipiscing elit. Quisque auctor lorem ex. Pellentesque tempus accumsan nulla, nec eleifend erat rhoncus vel. Ut commodo metus ipsum, sed accumsan risus placerat ut.
Lorem ipsum dolor sit amet, consectetur adipiscing elit. Aliquam placerat augue at velit tincidunt semper. Donec elementum porta posuere. Nullam interdum, odio at tincidunt feugiat, turpis nisi blandit eros, eu posuere risus felis non quam. Nam eget lorem odio. Duis et aliquet orci. Phasellus nec viverra est. Praesent odio orci, mattis vel mauris nec, consectetur fermentum mauris. Etiam eu hendrerit tortor. Donec mi tellus, efficitur et porttitor eu, auctor eu tellus. Quisque faucibus vestibulum sapien vel lacinia. Ut auctor lorem non interdum blandit.
Usually you want to have a nice table displaying some important results that you have calcualated. In posterdown this is as easy as using the kable table formatting you are probably use to as per typical RMarkdown formatting. I suggesting checking out the kableExtra package and its in depth documentation on customizing these tables found here (Zhu 2019). Hopfully I can make this with an inline refernce like, Table 3.1.
| Sepal.Length | Sepal.Width | Petal.Length | Petal.Width |
|---|---|---|---|
| 5.1 | 3.5 | 1.4 | 0.2 |
| 4.9 | 3.0 | 1.4 | 0.2 |
| 4.7 | 3.2 | 1.3 | 0.2 |
| 4.6 | 3.1 | 1.5 | 0.2 |
| 5.0 | 3.6 | 1.4 | 0.2 |
Look at this animation (Pedersen and Robinson 2017) !!!! Figure 3.1.
library(ggplot2)
library(gganimate)
library(gapminder)

ggplot(gapminder, aes(gdpPercap,
                      lifeExp,
                      size = pop,
                      colour = country)) +
  geom_point(alpha = 0.7, show.legend = FALSE) +
  scale_colour_manual(values = country_colors) +
  scale_size(range = c(2, 12)) +
  scale_x_log10() +
  facet_wrap(~continent) +
  # Here comes the gganimate specific bits
  labs(title = 'Year: {frame_time}',
       x = 'GDP per capita',
       y = 'life expectancy') +
  transition_time(year) +
  ease_aes('linear')
Figure 3.1: WOW THIS IS AN AWESOME GIF!
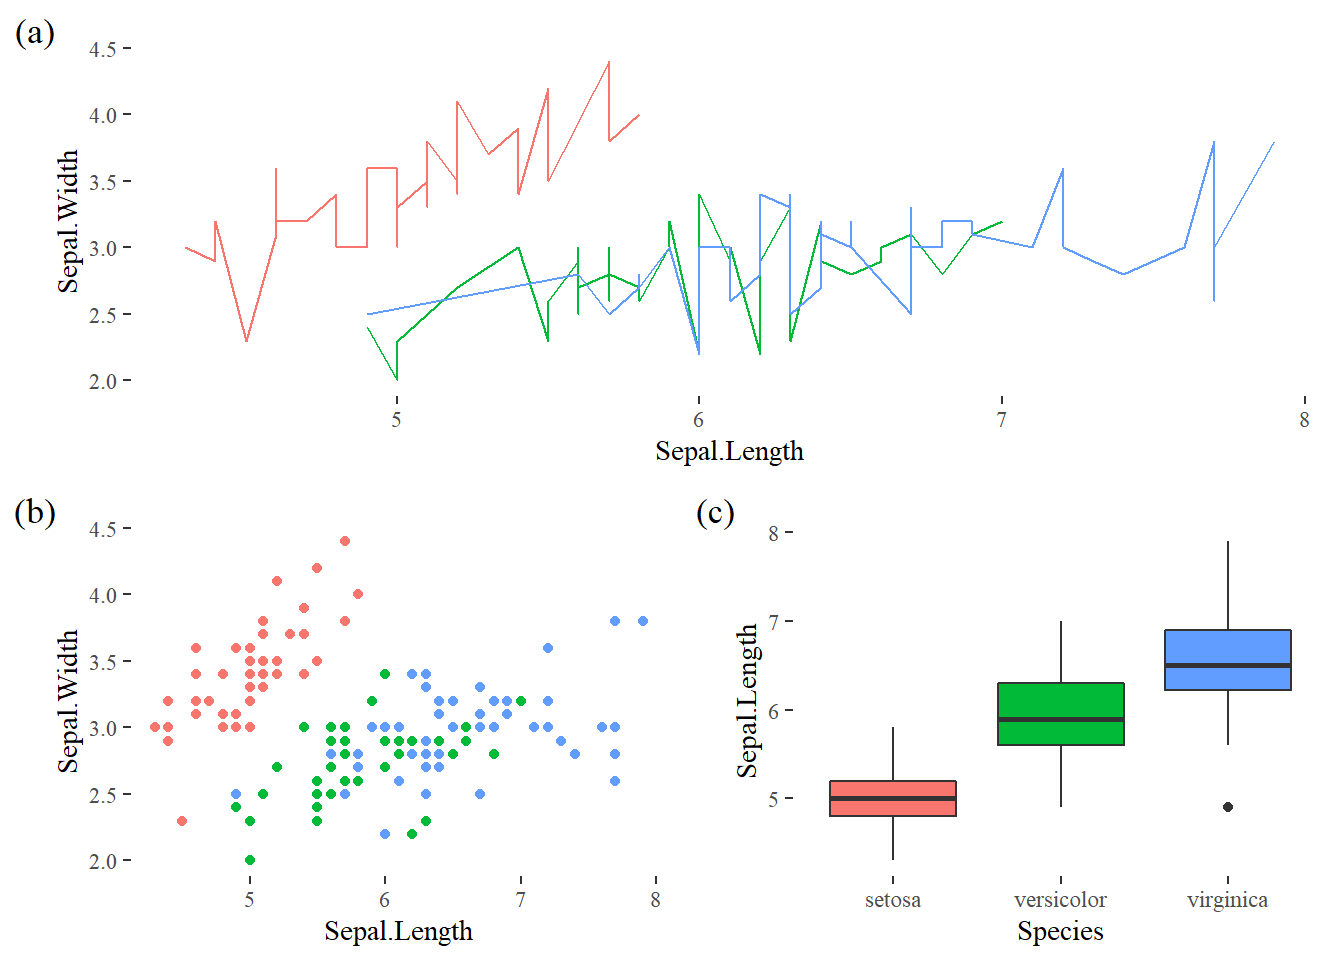
Figure 3.2: Using ggplot and patchwork to generate a layout of multiple plots in one figure. The iris dataset was used to generate (a) a line graph, (b) a scatterplot, and (c) a boxplot all together!
Lorem ipsum dolor sit amet, consectetur adipiscing elit. Aliquam placerat augue at velit tincidunt semper. Donec elementum porta posuere. Nullam interdum, odio at tincidunt feugiat, turpis nisi blandit eros, eu posuere risus felis non quam. Nam eget lorem odio. Duis et aliquet orci. Phasellus nec viverra est. Praesent odio orci, mattis vel mauris nec, consectetur fermentum mauris. Etiam eu hendrerit tortor. Donec mi tellus, efficitur et porttitor eu, auctor eu tellus. Quisque faucibus vestibulum sapien vel lacinia. Ut auctor lorem non interdum blandit.
Aliquam sed faucibus risus, quis efficitur erat. Vestibulum semper mauris quis tempus eleifend. Aliquam sagittis dictum ipsum, quis viverra ligula eleifend ut. Curabitur sagittis vitae arcu eget faucibus. In non elementum felis. Duis et aliquam nunc. Nunc pulvinar sapien nunc, vel pretium nisi efficitur in. Fusce fringilla maximus leo et maximus. Fusce at ligula laoreet, iaculis mi at, auctor odio. Praesent sed elementum justo. Aenean consectetur risus rhoncus tincidunt efficitur. Praesent dictum mauris at diam maximus maximus (Thorne 2019).
Lorem ipsum dolor sit amet, consectetur adipiscing elit. Aliquam placerat augue at velit tincidunt semper. Donec elementum porta posuere. Nullam interdum, odio at tincidunt feugiat, turpis nisi blandit eros, eu posuere risus felis non quam. Nam eget lorem odio. Duis et aliquet orci. Phasellus nec viverra est. Praesent odio orci, mattis vel mauris nec, consectetur fermentum mauris. Etiam eu hendrerit tortor. Donec mi tellus, efficitur et porttitor eu, auctor eu tellus. Quisque faucibus vestibulum sapien vel lacinia. Ut auctor lorem non interdum blandit.
Figure 5.1: Here is a leaflet figure which whill run as expected online, when printed it will take the last state it is left in beofre choosing to print.
Allaire, JJ, Yihui Xie, Jonathan McPherson, Javier Luraschi, Kevin Ushey, Aron Atkins, Hadley Wickham, Joe Cheng, Winston Chang, and Richard Iannone. 2018. Rmarkdown: Dynamic Documents for R. https://rmarkdown.rstudio.com.
Allaire, JJ, Yihui Xie, R Foundation, Hadley Wickham, Journal of Statistical Software, Ramnath Vaidyanathan, Association for Computing Machinery, et al. 2018. Rticles: Article Formats for R Markdown. https://CRAN.R-project.org/package=rticles.
Arnold, Jeffrey B. n.d. Ggthemes: Extra Themes, Scales and Geoms for ’Ggplot2’. http://github.com/jrnold/ggthemes.
Dunnington, Dewey. n.d. Ggspatial: Spatial Data Framework for Ggplot2. https://github.com/paleolimbot/ggspatial.
Pebesma, Edzer. 2018. Sf: Simple Features for R. https://CRAN.R-project.org/package=sf.
Pedersen, Thomas Lin, and David Robinson. 2017. Gganimate: A Grammar of Animated Graphics. http://github.com/thomasp85/gganimate.
Solomon, Nick. 2019. Thesisdown: An Updated R Markdown Thesis Template Using the Bookdown Package.
Thorne, W. Brent. 2019. Posterdown: An R Package Built to Generate Reproducible Conference Posters for the Academic and Professional World Were Powerpoint and Pages Just Wont Cut It. Vol. 0.1.2. https://github.com/brentthorne/posterdown.
Turner, Kevin W., Brent B. Wolfe, Thomas W. D. Edwards, Trevor C. Lantz, Roland I. Hall, and Guillaume Larocque. 2014. “Controls on Water Balance of Shallow Thermokarst Lakes and Their Relations with Catchment Characteristics: A Multi-Year, Landscape-Scale Assessment Based on Water Isotope Tracers and Remote Sensing in Old Crow Flats, Yukon (Canada).” Global Change Biology 20 (5): 1585–1603. https://doi.org/10.1111/gcb.12465.
Zhu, Hao. 2019. KableExtra: Construct Complex Table with ’Kable’ and Pipe Syntax. https://CRAN.R-project.org/package=kableExtra.